- はじめに
- Rパッケージのセットアップ
- PubMed全体でキーワード検索をやってみる
- 少し脱線して、年ごとの論文数をまとめてみた
- 本題に入って、googletransによる論文情報の和訳とレポート作成をやってみる
- まとめ
- 全Rコード in gist
- 補足
- 参考文献
はじめに
論文のトレンド解析であったり、個別の論文情報、主に要旨(Abstract)を取得してみた。 もう少し発展させて、Abstractの英文テキストの和訳をして、Rmarkdownのレポート作成するまでをやってみた。
今回扱う、RISmed パッケージは、PubMedを含むNational Center for Biotechnology Information (NCBI: アメリカ国立生物工学情報センター)のデータベースから論文情報を抽出するためのツール群である*1。
また、Abstractのテキスト和訳には、以前の記事で紹介した、Pythonの googletrans ライブラリを使用する。
Rパッケージのセットアップ
6つのRパッケージをインストール・ロードしておく。
if(!require("RISmed")){install.packages("RISmed")}; library(RISmed)
if(!require("magrittr")){install.packages("magrittr")}; library(magrittr)
if(!require("purrr")){install.packages("purrr")}; library(purrr)
if(!require("plotly")){install.packages("plotly")}; library(plotly)
if(!require("progress")){install.packages("progress")}; library(progress)
if(!require("reticulate")){install.packages("reticulate")}; library(reticulate)
RISmedパッケージで主に使用する関数は、EUtilsSummaryとEUtilsGetである。
EUtilsSummary: NCBIのデータベースに対するクエリの結果の概要情報を取得する関数。
EUtilsGet: NCBIのデータベースに対する検索結果をダウンロードする関数。
PubMed全体でキーワード検索をやってみる
"3d electron microscopy" (3D電顕)をキーワードに検索してみる。
# キーワード検索
SearchTerm <- "3d electron microscopy"

#PubMed検索
esearchResults <- SearchTerm %>%
  EUtilsSummary(query=., type="esearch", db="pubmed", retmax=10000)

#Queryとヒット数
summary(esearchResults)
#Query:
#3d[All Fields] AND ("microscopy, electron"[MeSH Terms] OR ("microscopy"[All Fields] AND
#"electron"[All Fields]) OR "electron microscopy"[All Fields] OR ("electron"[All Fields] AND
#"microscopy"[All Fields]))
#Result count:  7077

#データ構造の出力
str(esearchResults)
#Formal class 'EUtilsSummary' [package "RISmed"] with 6 slots
#  ..@ db              : chr "pubmed"
#  ..@ count           : num 7077
#  ..@ retmax          : num 7077
#  ..@ retstart        : num 0
#  ..@ PMID            : chr [1:7077] "32573315" "32571921" "32571173" "32569437" ...
#  ..@ querytranslation: chr "3d[All Fields] AND (\"microscopy, electron\"[MeSH Terms] OR
# (\"microscopy\"[All Fields] AND \"electron\"[All Fi"| __truncated__
次に、2020年の掲載論文に対して、キーワード検索を行ってみる。
Year <- 2020
SearchTerm <- "3d electron microscopy"

esearchResults2020 <- SearchTerm %>%
  EUtilsSummary(query=., type="esearch", db="pubmed", mindate=Year, maxdate=Year, retmax=10000)

#ヒット数の表示
QueryCount(esearchResults2020)
#OR
esearchResults2020@count
#[1] 312
次に、ヒットしたPMID*2をもとに、論文情報(雑誌名、論文タイトル、Abstract、MeSHとか)を検索してみる。
#PMIDを出力する
PubID <- QueryId(esearchResults2020)
PubID

#  [1] "32573315" "32571921" "32571173" "32569437" "32567732"
#  [6] "32566142" "32565223" "32559707" "32557536" "32556943"
# [11] "32554894" "32548815" "32548814" "32545804" "32545376"
# ......

#PMIDから、1つ目の論文情報(PMID "32573315")の検索
PubIDResults <- PubID[1] %>%
 EUtilsGet(type="efetch", db="pubmed")

PubIDResults
#PubMed query:
#   Records:  1

#Mesh headingsを調べる
Mesh(PubIDResults)
#[[1]]
#[1] NA
#ただし、この論文はMeshが付与されてないみたい
MeSH (Medical Subject Headings) は、米国国立医学図書館 (National Library of Medicine; NLM)で定める生命科学用語集(シソーラス)である。調べた論文はNAだったが、文献の内容を表す適切なMeSH用語を10〜15個程度文献に付与し、この用語により文献を検索・管理できるようにしているらしい*3。
#データのリスト化
Results <- list(PubIDResults@PMID,
                PubIDResults@Author,
                PubIDResults@Title,
                PubIDResults@ArticleTitle,
                PubIDResults@AbstractText)
データをリスト化しておく、データ表示については後述する。
少し脱線して、年ごとの論文数をまとめてみた
年ごとの論文数をまとめることで、そのキーワードの研究トレンドを把握できると考えられる。
そこで、対象キーワードの年ごとの論文数を集計する関数を導入する。
PubNumber <- function(i){
  r <- EUtilsSummary(terms, type='esearch', db='pubmed', mindate=i, maxdate=i)
  return(QueryCount(r))
}
この関数に対して、map関数で、年数のベクトル値(i)とキーワード(terms)を与えてあげると、年ごとの論文数を検索できる。
コロナウィルス(Coronavirus)をキーワードに、1970-2020年の1年ごとで論文数を検索して、可視化みる。
#Coronavirus publications in PubMed
terms <- "Coronavirus"
Years <- 1970:2020

PubNum <- purrr::map(Years, PubNumber)
Data <- data.frame(Years, PubNumber=unlist(PubNum))

fig <- plot_ly(Data, x = ~Years, y = ~PubNumber, type = 'bar', name = 'Publications',
               marker = list(color = 'rgb(158,202,225)', line = list(color = 'rgb(8,48,107)', width = 1)))
fig <- fig %>% layout(title = paste("Number of PubMed articles containing ", terms, sep=""),
                      yaxis = list(title = 'Count'),
                      xaxis = list(title = "Year"))
fig
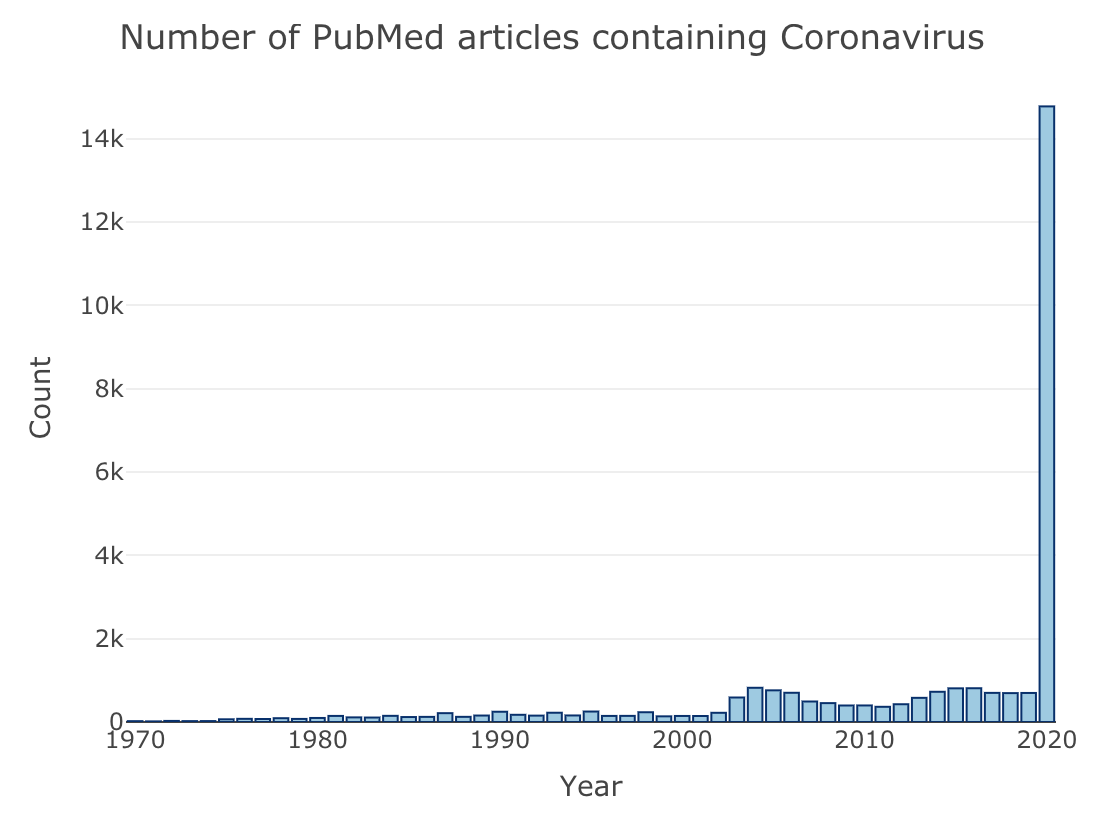
今年すでに論文数が10倍以上に爆増している。。。*4
さらに、ディープラーニング(Deep learning)について同じく検索してみる。
#Deep learning publications in PubMed
terms <- "deep learning"
Years <- 1970:2020

PubNum <- purrr::map(Years, PubNumber)
Data <- data.frame(Years, PubNumber=unlist(PubNum))

fig <- plot_ly(Data, x = ~Years, y = ~PubNumber, type = 'bar', name = 'Publications',
               marker = list(color = 'rgb(158,202,225)', line = list(color = 'rgb(8,48,107)', width = 1)))
fig <- fig %>% layout(title = paste("Number of PubMed articles containing ", terms, sep=""),
                      yaxis = list(title = 'Count'),
                      xaxis = list(title = "Year"))
fig
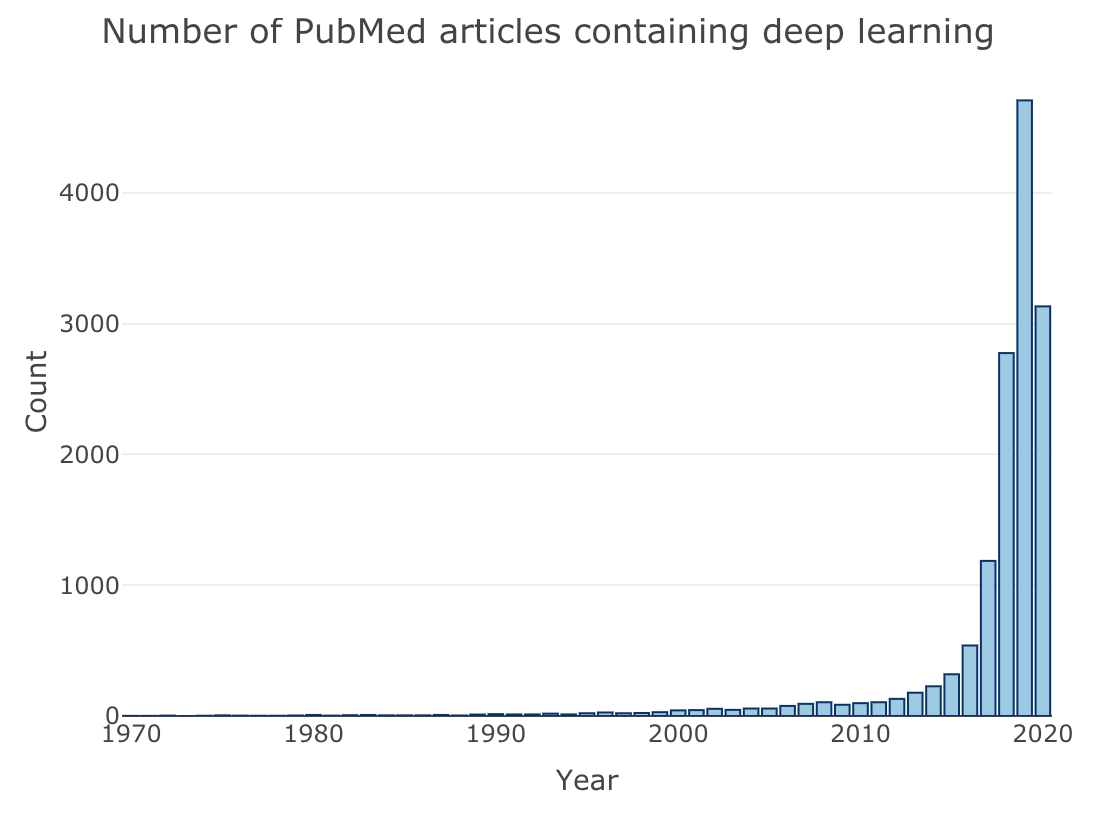
2015-2016年あたりから、生命科学分野でのディープラーニングの応用が目覚ましいものといえる。
いちおう、この検索とグラフ化を1つの関数にしたので、以下の2行で同じことが実行できる(はず)。
source("https://gist.githubusercontent.com/kumeS/a9e612c6bb484451e6328f119fd9ef56/raw/481884897a54e51bc67b7dbd794fcfe9404a8166/PublicationPerYear.R")

PublicationPerYear(Term="deep learning")
本題に入って、googletransによる論文情報の和訳とレポート作成をやってみる
さきほどResultsにリストとして格納した論文情報を和訳してみる。
#念のため、別変数に置き換え translatedResults <- Results #Pythonパスの設定とgoogletransライブラリの読み込み reticulate::use_python("/usr/local/bin/python", required =T) gt <- reticulate::import(module = "googletrans")$Translator() #エラーの原因となる、ゴミ文字を消しておく TEXT01 <- gsub(""", "", translatedResults[[5]]) #雑誌名、論文タイトル、Abstractの順にgoogletransによる和訳の実行 translateResults01 <- gt$translate(text=Results[[3]], src="en", dest='ja') translateResults02 <- gt$translate(text=Results[[4]], src="en", dest='ja') translateResults03 <- gt$translate(text=TEXT01, src="en", dest='ja') #処理関数の定義 "CutText" <- function(x){ strsplit(strsplit(as.character(x), ", text=")[[1]][2], ", pronunciation=")[[1]][1] } #結果の上書き translatedResults[[3]][2] <-CutText(translateResults01) translatedResults[[4]][2] <-CutText(translateResults02) translatedResults[[5]][2] <-CutText(translateResults03) #結果出力 translatedResults
変数のままだと、テキストが読みにくいので、RMarkdownでhtmlファイルを生成してみる。
以前の記事に倣って、wgetはインストールしておくこと。
#RMarkdownフォーマットのダウンロード
system('wget https://gist.githubusercontent.com/kumeS/8a4410c7f9d07a0b49192bcda4bf1e03/raw/b8db496b0c13fa98affd654f03d45e17cf41ea08/Basic_report_jpn.Rmd')

#レンダリング(変数名は上記と同じにしておく)
rmarkdown::render("Basic_report_jpn.Rmd",
                  output_format = "html_document",
                  output_file = "output.html")

#htmlのブラウザ表示
browseURL("output.html")
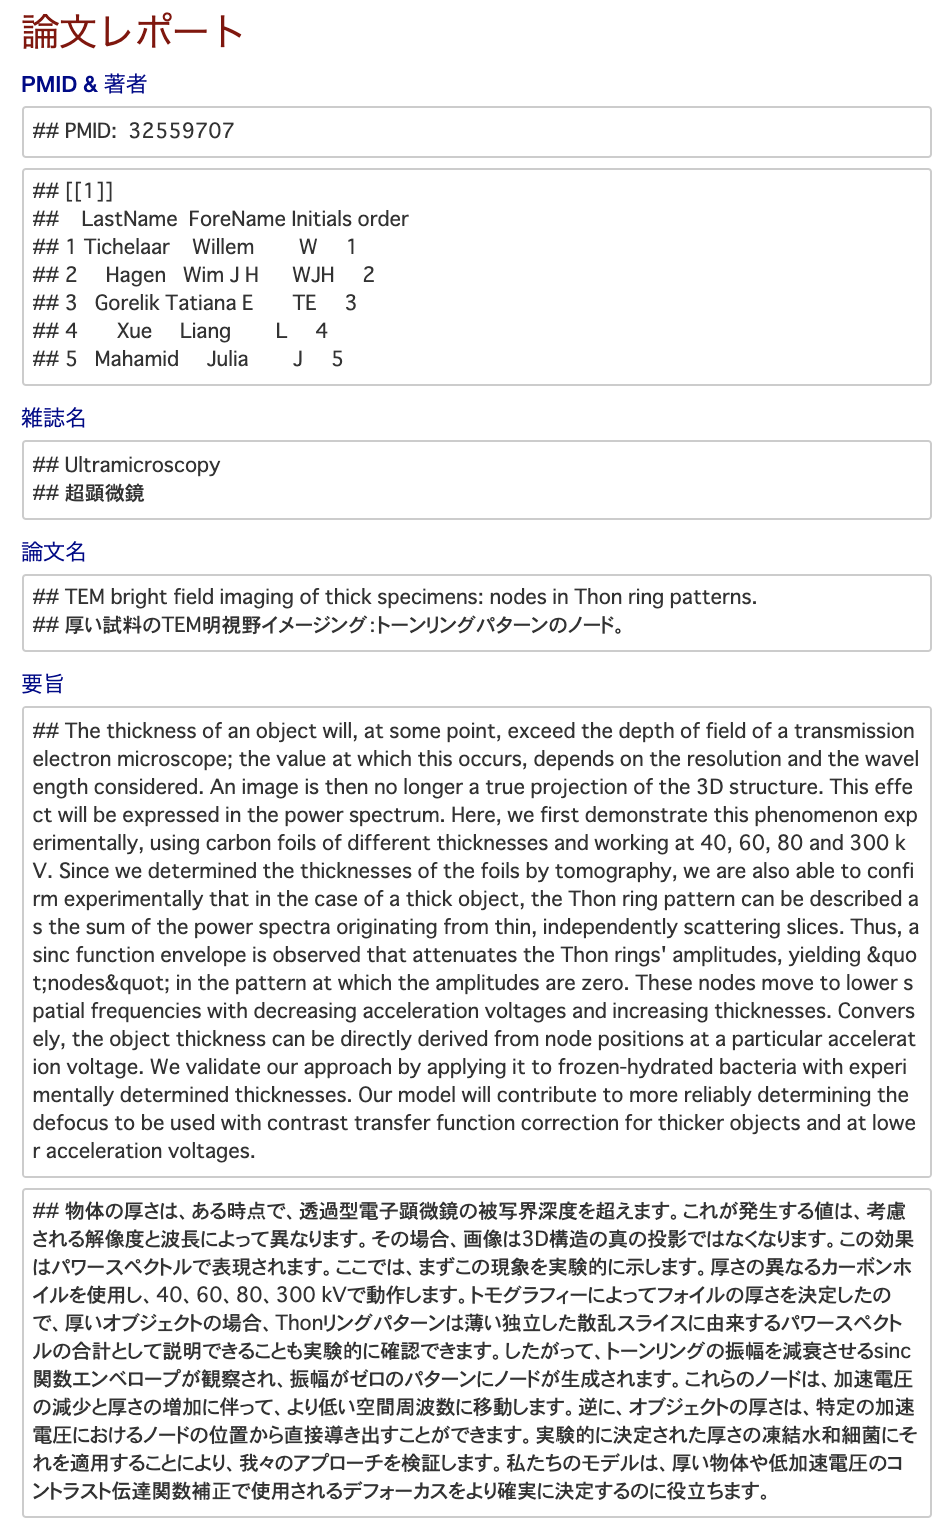
こんな感じの簡易Rmarkdownレポートが出力される。
まとめ
トレンド解析とともに、論文のサーチを定期的にちゃんとやるきっかけになればと期待したい。
全Rコード in gist
To search the PubMed DB and translate the abstract to the Japanese text. · GitHub
補足
MEDLINEタグ情報*5
PubMedで、文献検索を行うときに、検索クエリに語句を記入して検索すると、タイトル、要旨、著者、MeSH等どこかに含まれる文献が検索される。
雑誌名に限定したい場合や、タイトルに限定したい場合は、タグを指定することで限定できる。
例えば、"cancer"[TA] とすることで、cancer という雑誌で指定できる。応用として、AND、OR、NOT を使って2つ以上の検索結果の論理積・論理和・論理否定も求められる。論理式は大文字で書くことでキーワードと区別される。
PubMedにおける主要なタグ
| データフィールド | タグ | 説明 |
|---|---|---|
| Affiliation | [AD] | 筆頭著者の所属機関 |
| All Fields | [ALL] | 全てのフィールド |
| Author | [AU] | 著者。名字+名前の頭文字。徳川家康なら"Tokugawa I"[AU]。名字だけでもOK |
| First Author | [1AU] | 筆頭著者 |
| Publication Date | [DP] | 発行日、2001[DP]等で指定 |
| Full Author Name | [FAU] | 著者のフルネーム |
| Last Author | [LASTAU] | 最終著者 |
| MeSH Terms | [MH] | MeSH用語で付与された文献の主題 |
| MeSH Major Topic | [MAJR] | MeSH用語で付与される10~15の主題のうち、2つ程度の主要用語 |
| Page Number | [PG] | ページ |
| PMID | [PMID] | PubMed登録番号 |
| Journal | [TA], [JO] | 雑誌名 |
| Title | [TI] | タイトル |
| Title/Abstract | [TIAB] | タイトルあるいは要旨 |
| Text word | [TW] | テキスト本文 |
参考文献
*1:https://cran.r-project.org/web/packages/RISmed/index.html
*2:PubMed に収録されている論文にはPubMed ID (PMID) と呼ばれるIDが付与されている
*3:https://ja.wikipedia.org/wiki/MeSH
*4:この図は、2020年6月22日の結果で、6/25には論文数は15k以上になっていた。